As engineers, we often prioritize scalability, elegance, and efficiency in finding solutions. We despise monotony, tedious tasks, and boring work that consume our time. It becomes especially frustrating when we identify a tool that can reduce effort and produce better results, only to be turned down by management. This article will guide you on how to effectively communicate your tool request to management, increasing the chances of getting a 'Yes' for your proposal.
You’re Not Asking The Right Way
You may find it obvious why the tool you recommend is a great investment. It saves time, improves results, and allows you to focus on high-return activities for your organization. However, management doesn't always grasp these benefits. Why is that?
The reason lies in how you present your case. Management is primarily concerned with the organization's Profit and Loss (P&L). Their role is to maximize revenue while minimizing costs. When you propose a tool, simply highlighting time savings or improved output these don’t necessarily resonate. They are one step removed from what truly matters to management. Unless you can quantify the impact of the tool on P&L, management will perceive it as an "additional cost."
Show Impact on P&L
So, how can we translate the "additional cost" into improving the P&L? It's actually quite straightforward. While there will be an initial cost associated with the tool, evaluating it in isolation is not a fair assessment of the P&L impact. To present the impact properly, you need to calculate the additional revenue generated by the tool or the opportunity cost of not having it. The sum of the additional revenue (Rev_gen) and the opportunity cost (Opp_cost) subtracted from the tool cost will quantify the impact on the P&L.
PL_impact = Rev_gen - (Tool_cost - Opp_cost)
Provided you can demonstrate that investing in your tool will result in a positive PL_impact (> 0), management should find it an easy decision to support.
How To Calculate P&L Impact
Now that we know what needs to be quantified (Rev_gen and Opp_cost), let's discuss the general methodology used to quantify them.
- Identify the input parameters required to calculate Rev_gen and Opp_cost.
- Write down the expression that dictate the calculations for each parameter. Assumptions are acceptable and often expected.
- Build a simple model (a spreadsheet, no LLM required 😉) to calculate Rev_gen and Opp_cost based on the input parameters.
- Present the calculations in a straightforward and simple manner. It's crucial to show all the math. It should be laid out so simply, that even a middle schooler can follow the logic.
Example - Calculating Opportunity Cost
In the following example we will show how we at liblab calculate the opportunity cost associated with building and maintaining SDKs for an API manually. This allows us to enable our customers to show that leveraging liblab’s products & services are a fraction of the cost of tackling the problem yourself (we assume a Rev_gen of 0, for simplicity sake)
Opp_cost = APIs * Num_SDK * Cost_build+maintain_per_SDK
-
Input Parameters
- APIs = Number of APIs your organization needs SDKs for
- Num_SDK: Number of SDK languages you need to support for your APIs
- Cost_build+maintain_per_SDK can be further broken down into:
- Cost_build/SDK: Engineering cost per SDK build
- Cost ($) / Hour derived from engineering salary
- Hours / SDK Build (assumption based on your organization's API complexity)
- Cost_maintain/SDK: Engineering cost per change and number of changes
- Cost ($) / Hour derived from engineering salary
- Hours / SDK Build (assumption based on your organization's API complexity)
- Update Frequency (assumption on how often your API changes)
- Cost_build/SDK: Engineering cost per SDK build
-
Model calculating Opp_cost based on input parameters:
- The reason we want to put this in a spreadsheet model vs. just writing the equations and answers out is because it makes it easy for management to see the end result, if they don’t agree with one of your assumptions - most of the times this won’t change the decision on the tool but will help deal with any objections they may have.
- See models governing equations below:
Opp_cost = APIs * Num_SDK * (Cost_build + Cost_maintain) per SDK
Cost_build/SDK = Cost_hr * Hrs_build
Cost_maintain/SD = Cost_hr * Hrs_maintain * Update_frequency -
Present the Math Simply - Below is a screenshot of our liblab Investment Calculator
- This calculator depicts the investment needed by an average liblab customer if they are to build and maintain SDKs across 6 languages themselves for a single API.
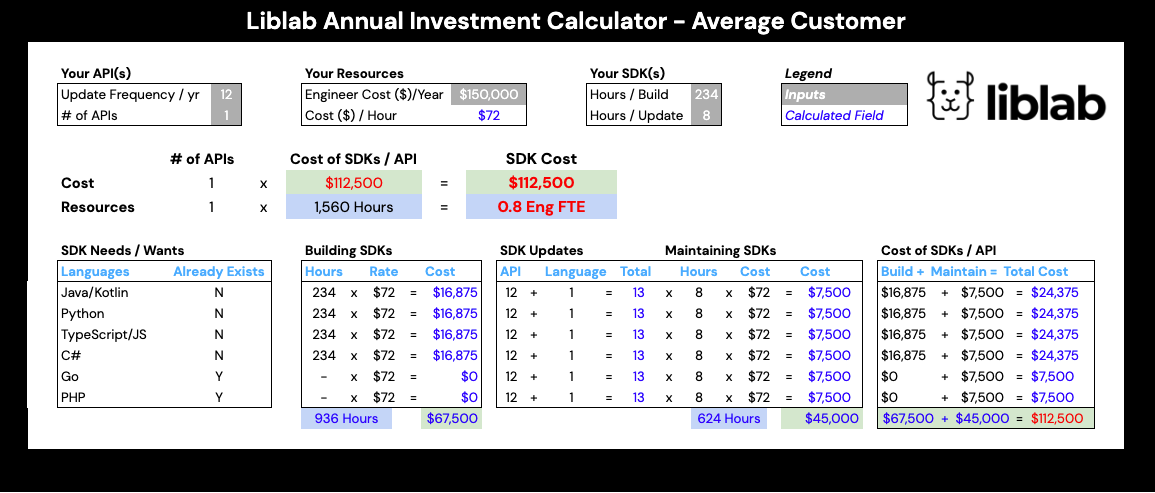
As you can see, the cost of building and maintaining SDKs for our average customers exceeds $100K. Making the cost of liblab’s product and services a fraction of the opportunity cost, resulting in very good return and positive impact on P&L.
Conclusion
To obtain a "Yes" from management for the tools you need, demonstrate through a model how they will have a positive impact on the P&L.
At liblab, we have created a calculator that helps developers articulate the cost savings of using our services to management. Not to mention the additional impact a better developer experience can have on their business (not quantified in our calculator).
If you're interested in receiving a free estimate of your annual API SDK investment, reach out to us via our contact form and mention "Free SDK Investment Assessment" in the message field. We'll respond promptly and provide you with a customized report breakdown, similar to the example above, tailored to your organization.